Good starts can make or break a race. But how do you accurately assess and improve your starting technique? Integrating data—like time-to-line, boat speed, and positioning—can accelerate the learning curve. Here’s how to set up a concise, data-driven clinic focused on practicing starts.
1. Why Data?
Pinpoint Mistakes: Tracking time and distance to the line reveals exactly where you’re going wrong.
Objective Feedback: Replace subjective comments with precise metrics to identify patterns and measure improvements.
Easy Progress Tracking: By comparing data from each practice session, you’ll quickly see if you’re improving or slipping back into old habits.
2. Setting Up the Clinic
a) Define the focus (you choose!)
Time & Distance Mastery: Perfecting the final minute to the start.
Acceleration & Boat Handling: Optimizing trim for a swift, controlled jump at the gun.
Recognizing & Using Line Bias: Learning to identify which end is favored—and how to capitalize on it. Use data to confirm whether your bias call matches reality on the water.
b) Start on a known minute
Plan each start sequence to begin at a precise minute—e.g., 2:00 PM, 2:05 PM, 2:10 PM. This helps pinpoint the exact “gun time” in your tracking software. You can quickly align GPS logs or video footage with the official clock, making your analysis more efficient.
c) Gather Tools
GPS Data from Phone or Wearable: Use a smartphone, Garmin watch, Apple Watch, Vakaros, Sailmon, or any other tracking device to measure boat speed, heading, and time-to-line.
Video or Drone Coverage (Optional): If you have the resources, consider recording each start from the air or onboard cameras. Footage can offer valuable visuals of positioning and maneuvers.
Coordinate Strategy for the Start Line: If the coach is stationed at the boat end for every start, record a GPS track on your phone or watch or use a "ping" feature on a Vakaros or GPS watch to capture exact coordinates. You'll also need to capture the pin end. As a last resort, you can estimate the location of the line—but accurate coordinates greatly increase the value of post-practice analysis.
3. Structuring Your Practice Starts
Here are a few suggestions for organizing each start drill:
Vary the Line Length: Shorten or lengthen the start line to mimic different crowding scenarios.
Experiment with Line Bias: Tilt the line so one end is favored, then reverse it for the next sequence to practice spotting and exploiting bias.
Set Short vs. Spaced Sequences: You might schedule a series of back-to-back starts every 5 minutes or leave longer intervals for rest and discussion.
Adjust for Conditions: If the wind shifts, reposition marks or the committee boat so sailors must react to changing angles.
Starting each drill at a known, consistent minute—and capturing accurate line coordinates—makes it simpler to line up your data with a precise timeline and location.
4. Preparing the Data
Once you’ve collected GPS information on the water, you’ll need a clear system for organizing and sharing it:
Create a SailSync Session: As the coach, set up a new session on SailSync where all the day’s data will be stored.
Share the Link with Sailors: Ask each participant to upload their boat’s GPS data (from a phone, watch, or other device) to the session, so everyone’s tracks can be compared in one place.
Manage Start-Line Coordinates (with a vakaros ping): Upload the .vkx track file, and you will automatically see the start line coordinates added with the updates. If multiple boats pinged the line their updates will be merged together always priortizing the most recent update.
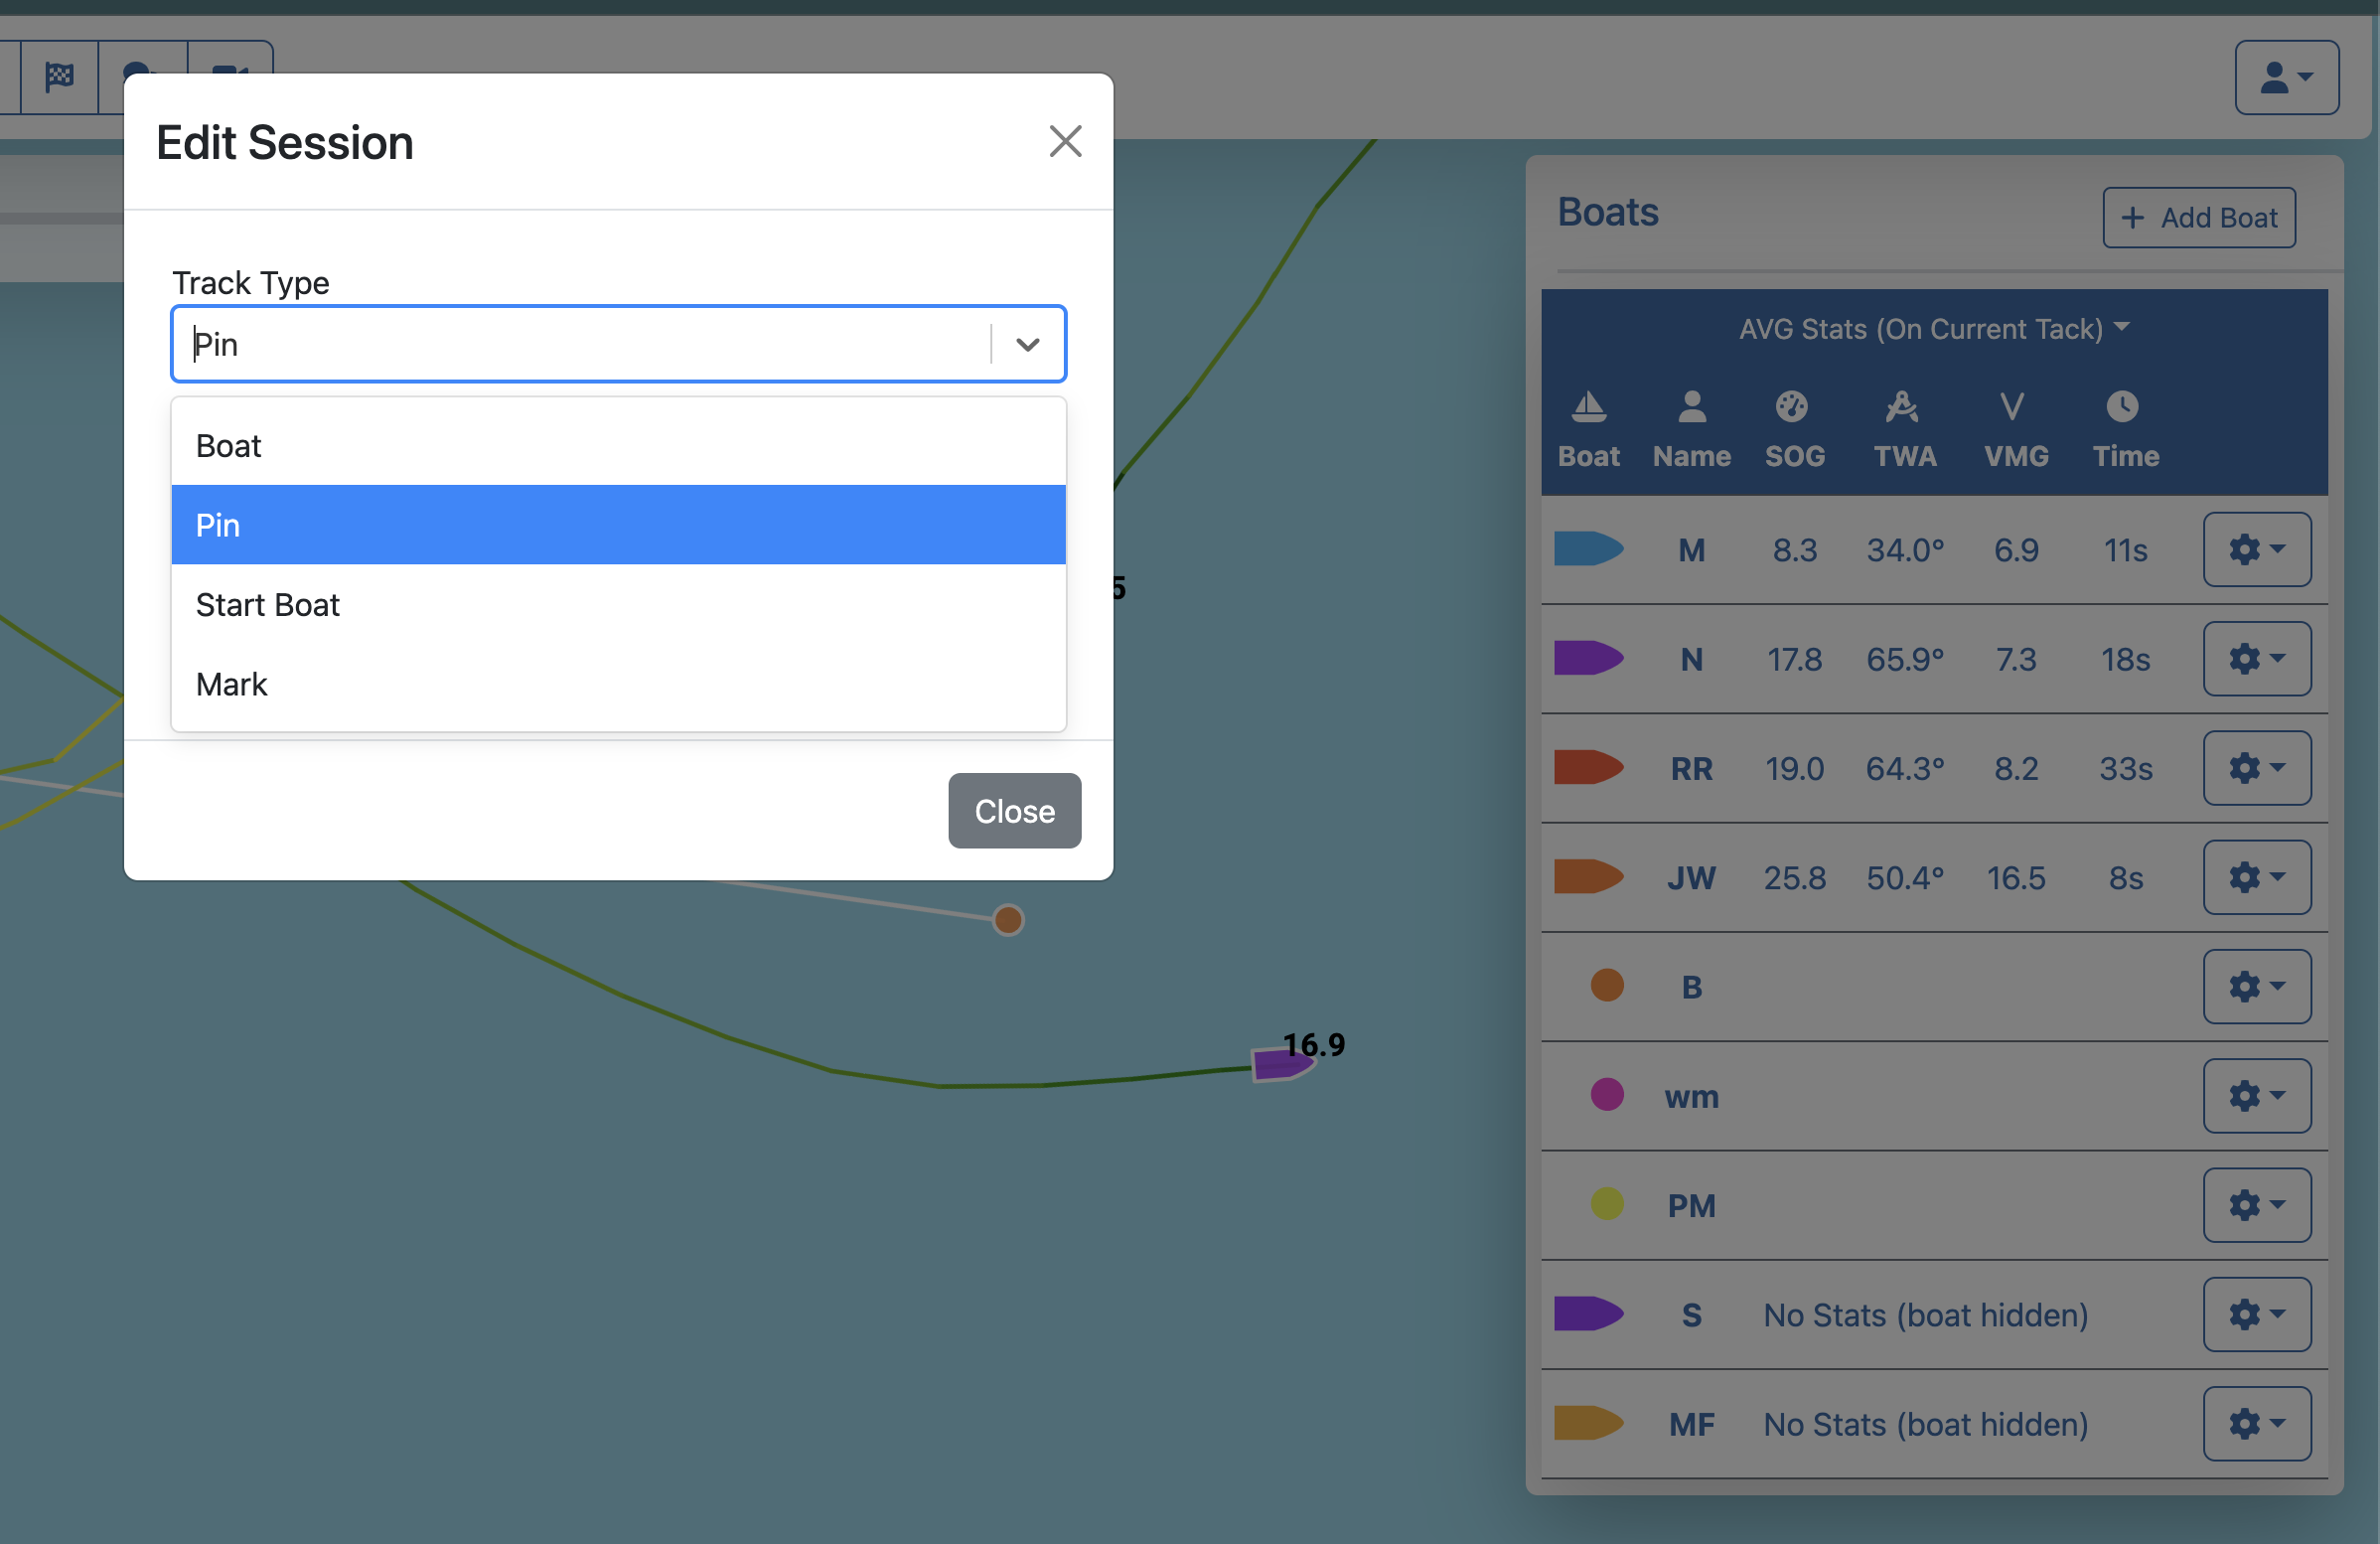
Manage Start-Line Coordinates (with a full gps track): Upload the track as you normally would, then click "Edit" on the track and changfe it type to either "Pin" or "Start boat".
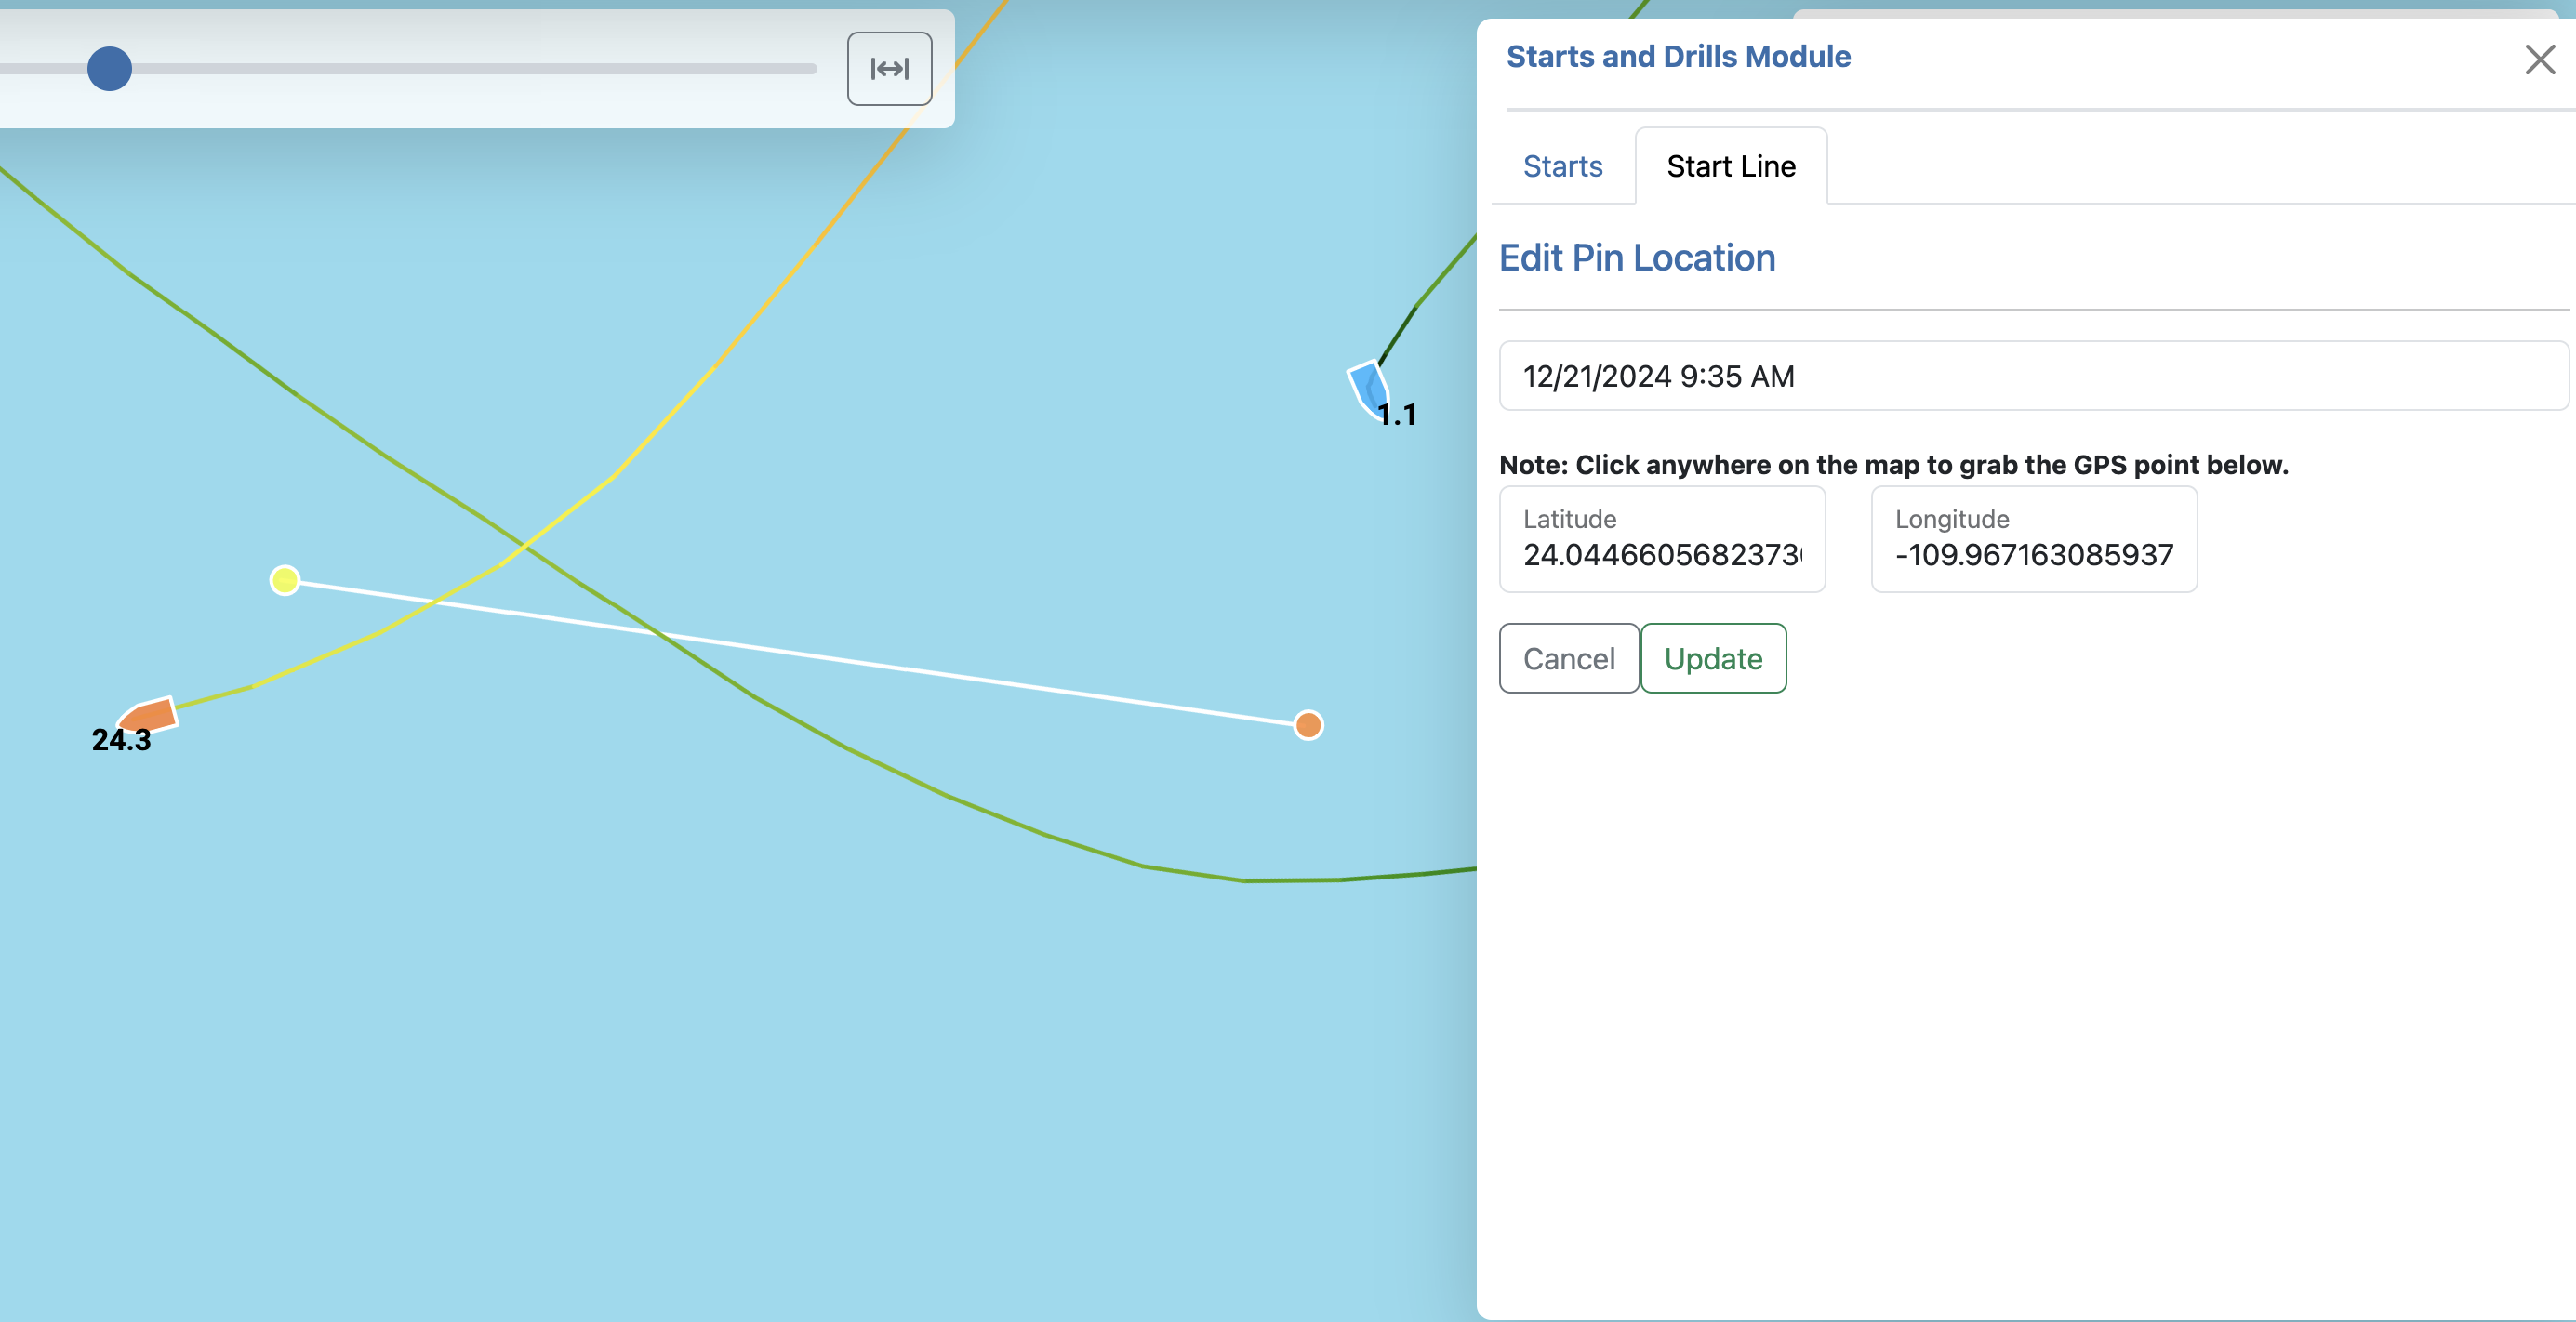
Manage Start-Line Coordinates (with manual pings): Go to Start Module -> "Start Line" -> Pin/Start Boat -> Add Point. This will let you specify the lat/lng points for the ping you captured earlier.
Manage Start-Line Coordinates (with best guess): Go to Start Module -> "Start Line" -> Pin/Start Boat -> Add Point. Find a moment that looks like a start and then click on the map to set it to that GPS location.
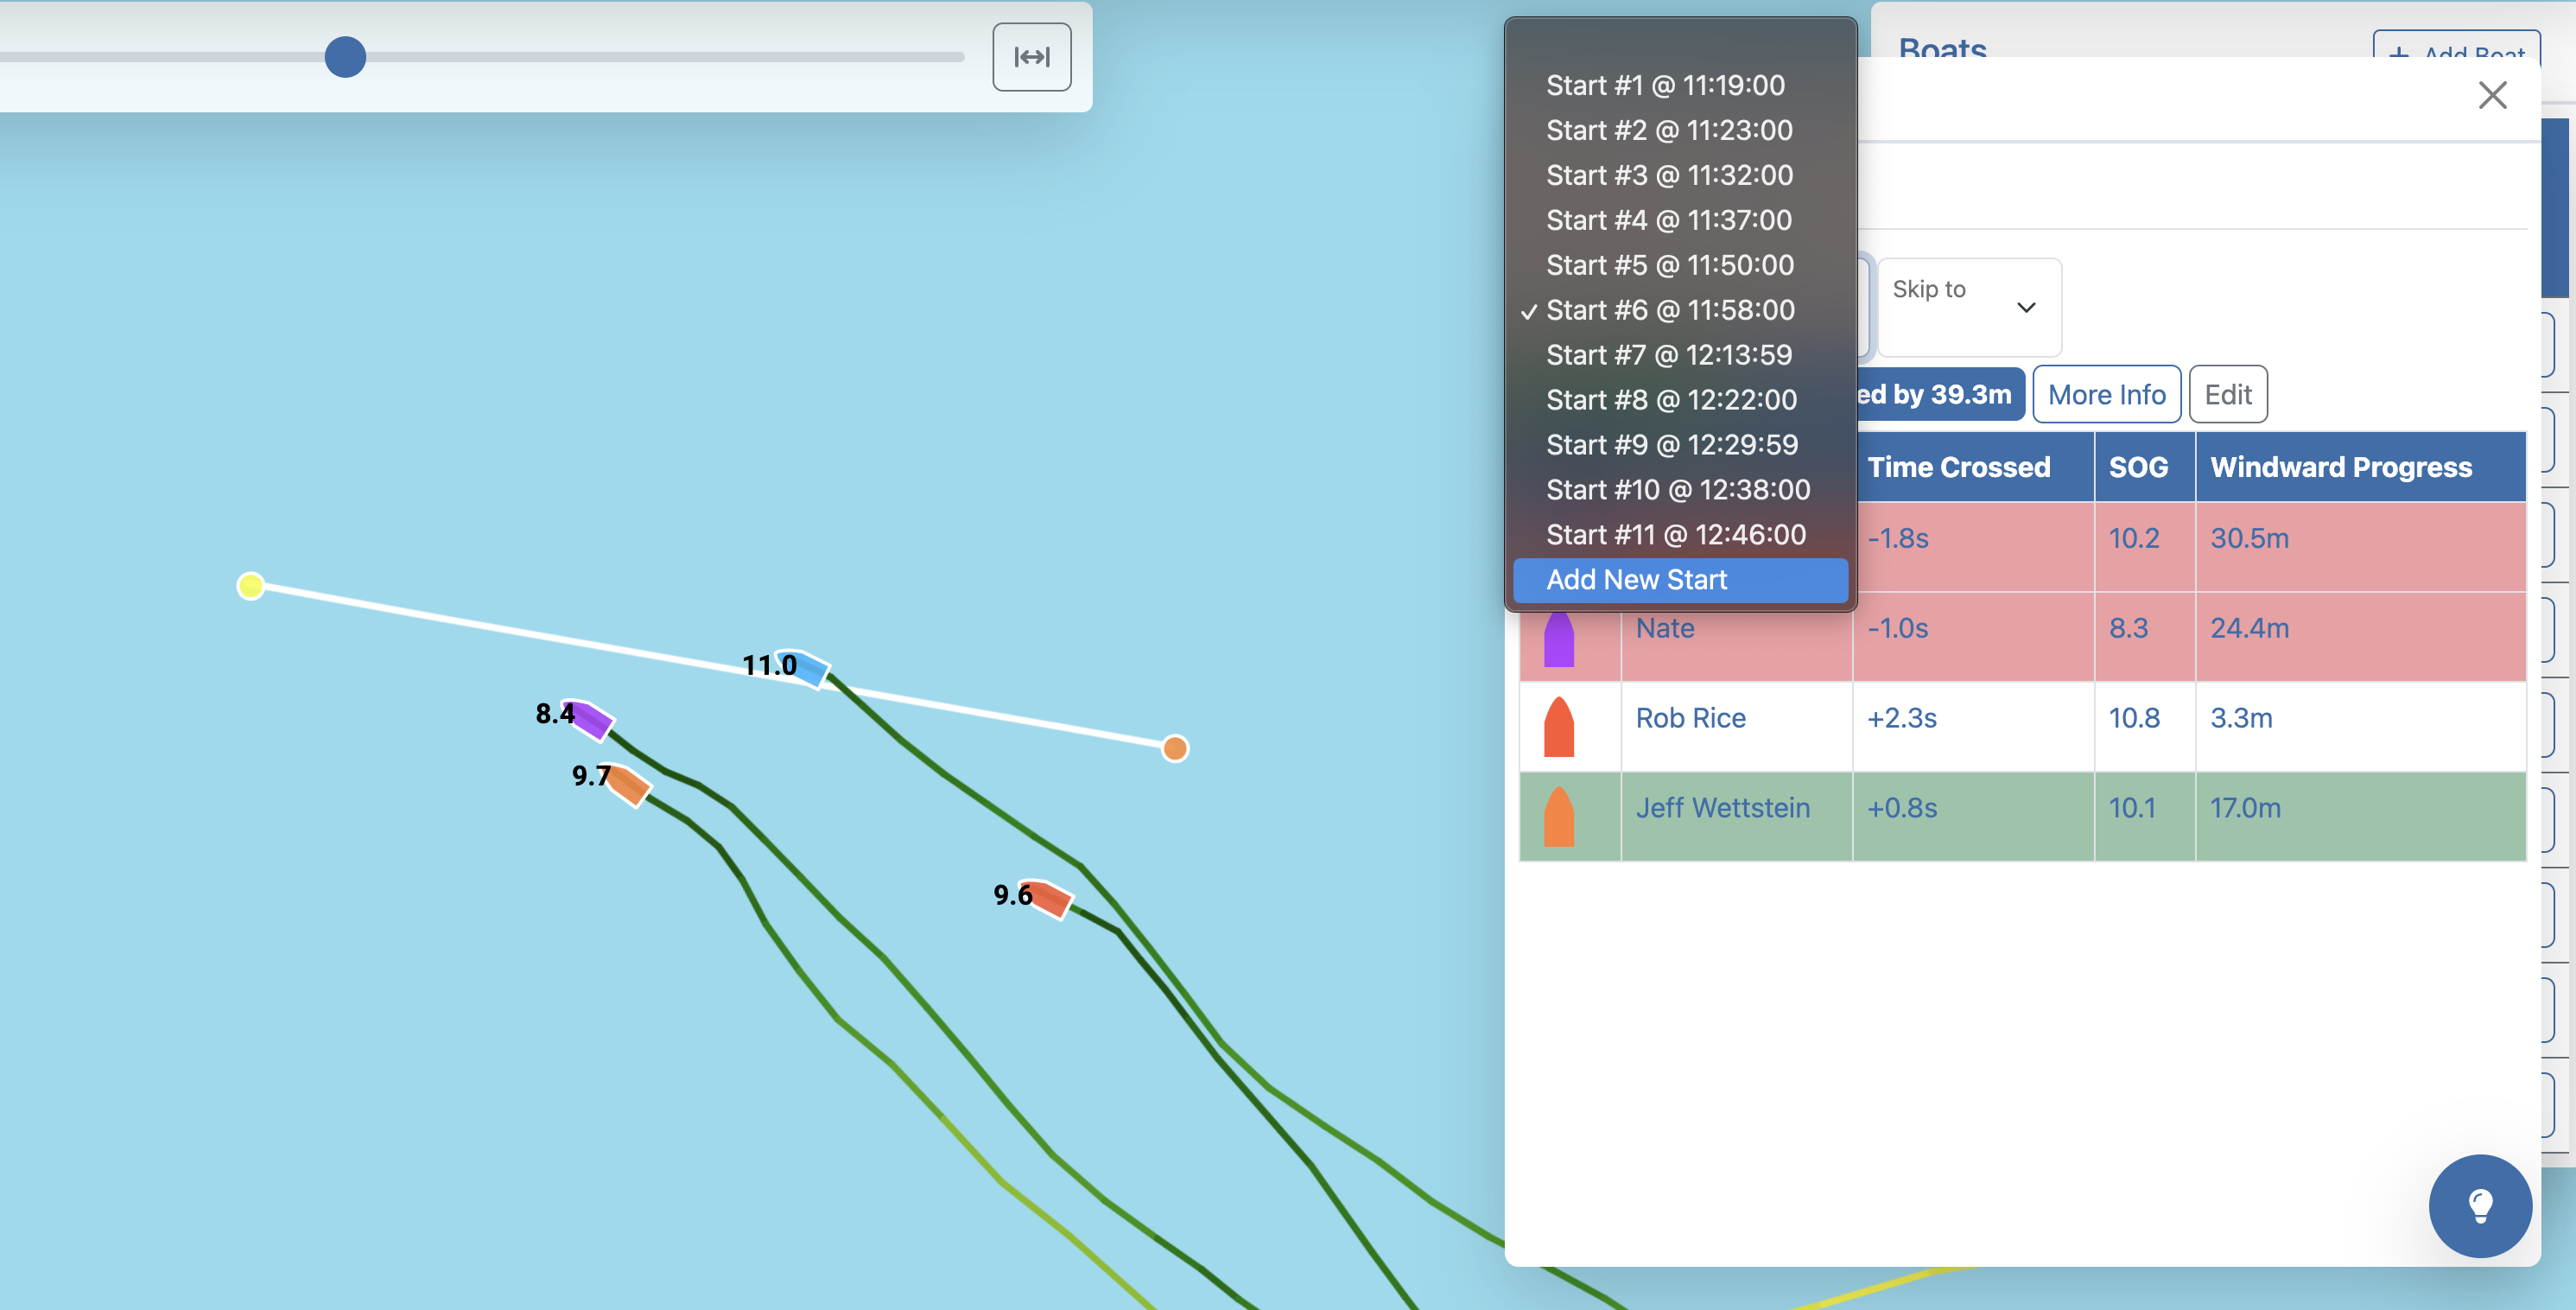
Add all your starts With the Start Module open drag the time navigation tool until you find a start. Then click "Add Start". You will be able to update it to the exact time of the start, which should be easy if you started it on an exact minute (just set the seconds to the nearest minute).
Having precise coordinates for each end of the line ensures your analysis will match the on-water reality, which is far more accurate than guessing.
5. Debrief & Analysis
a) Reviewing the Data
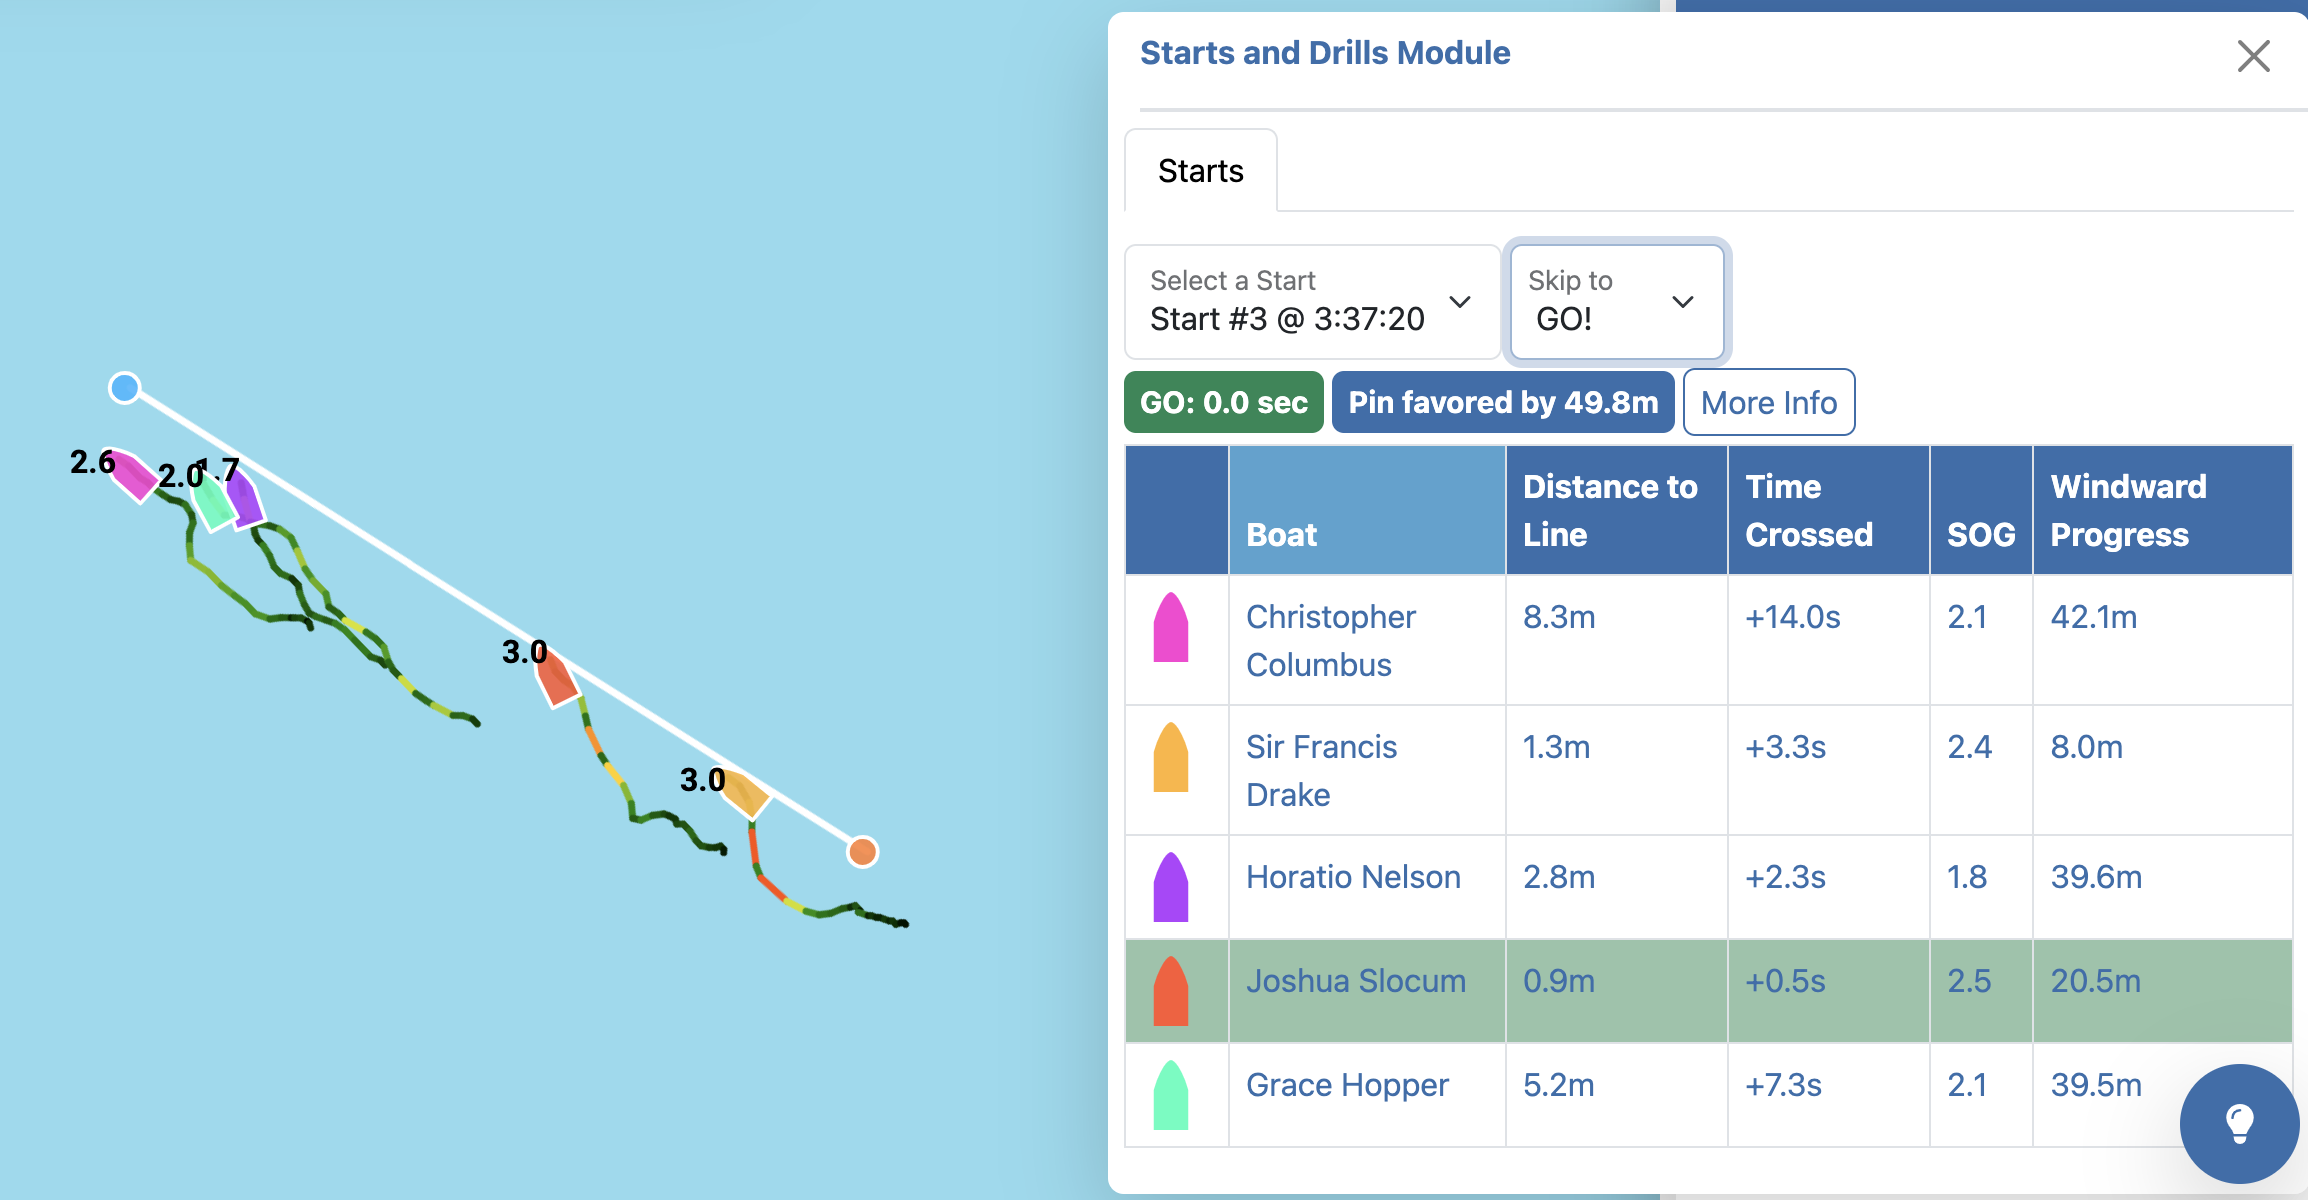
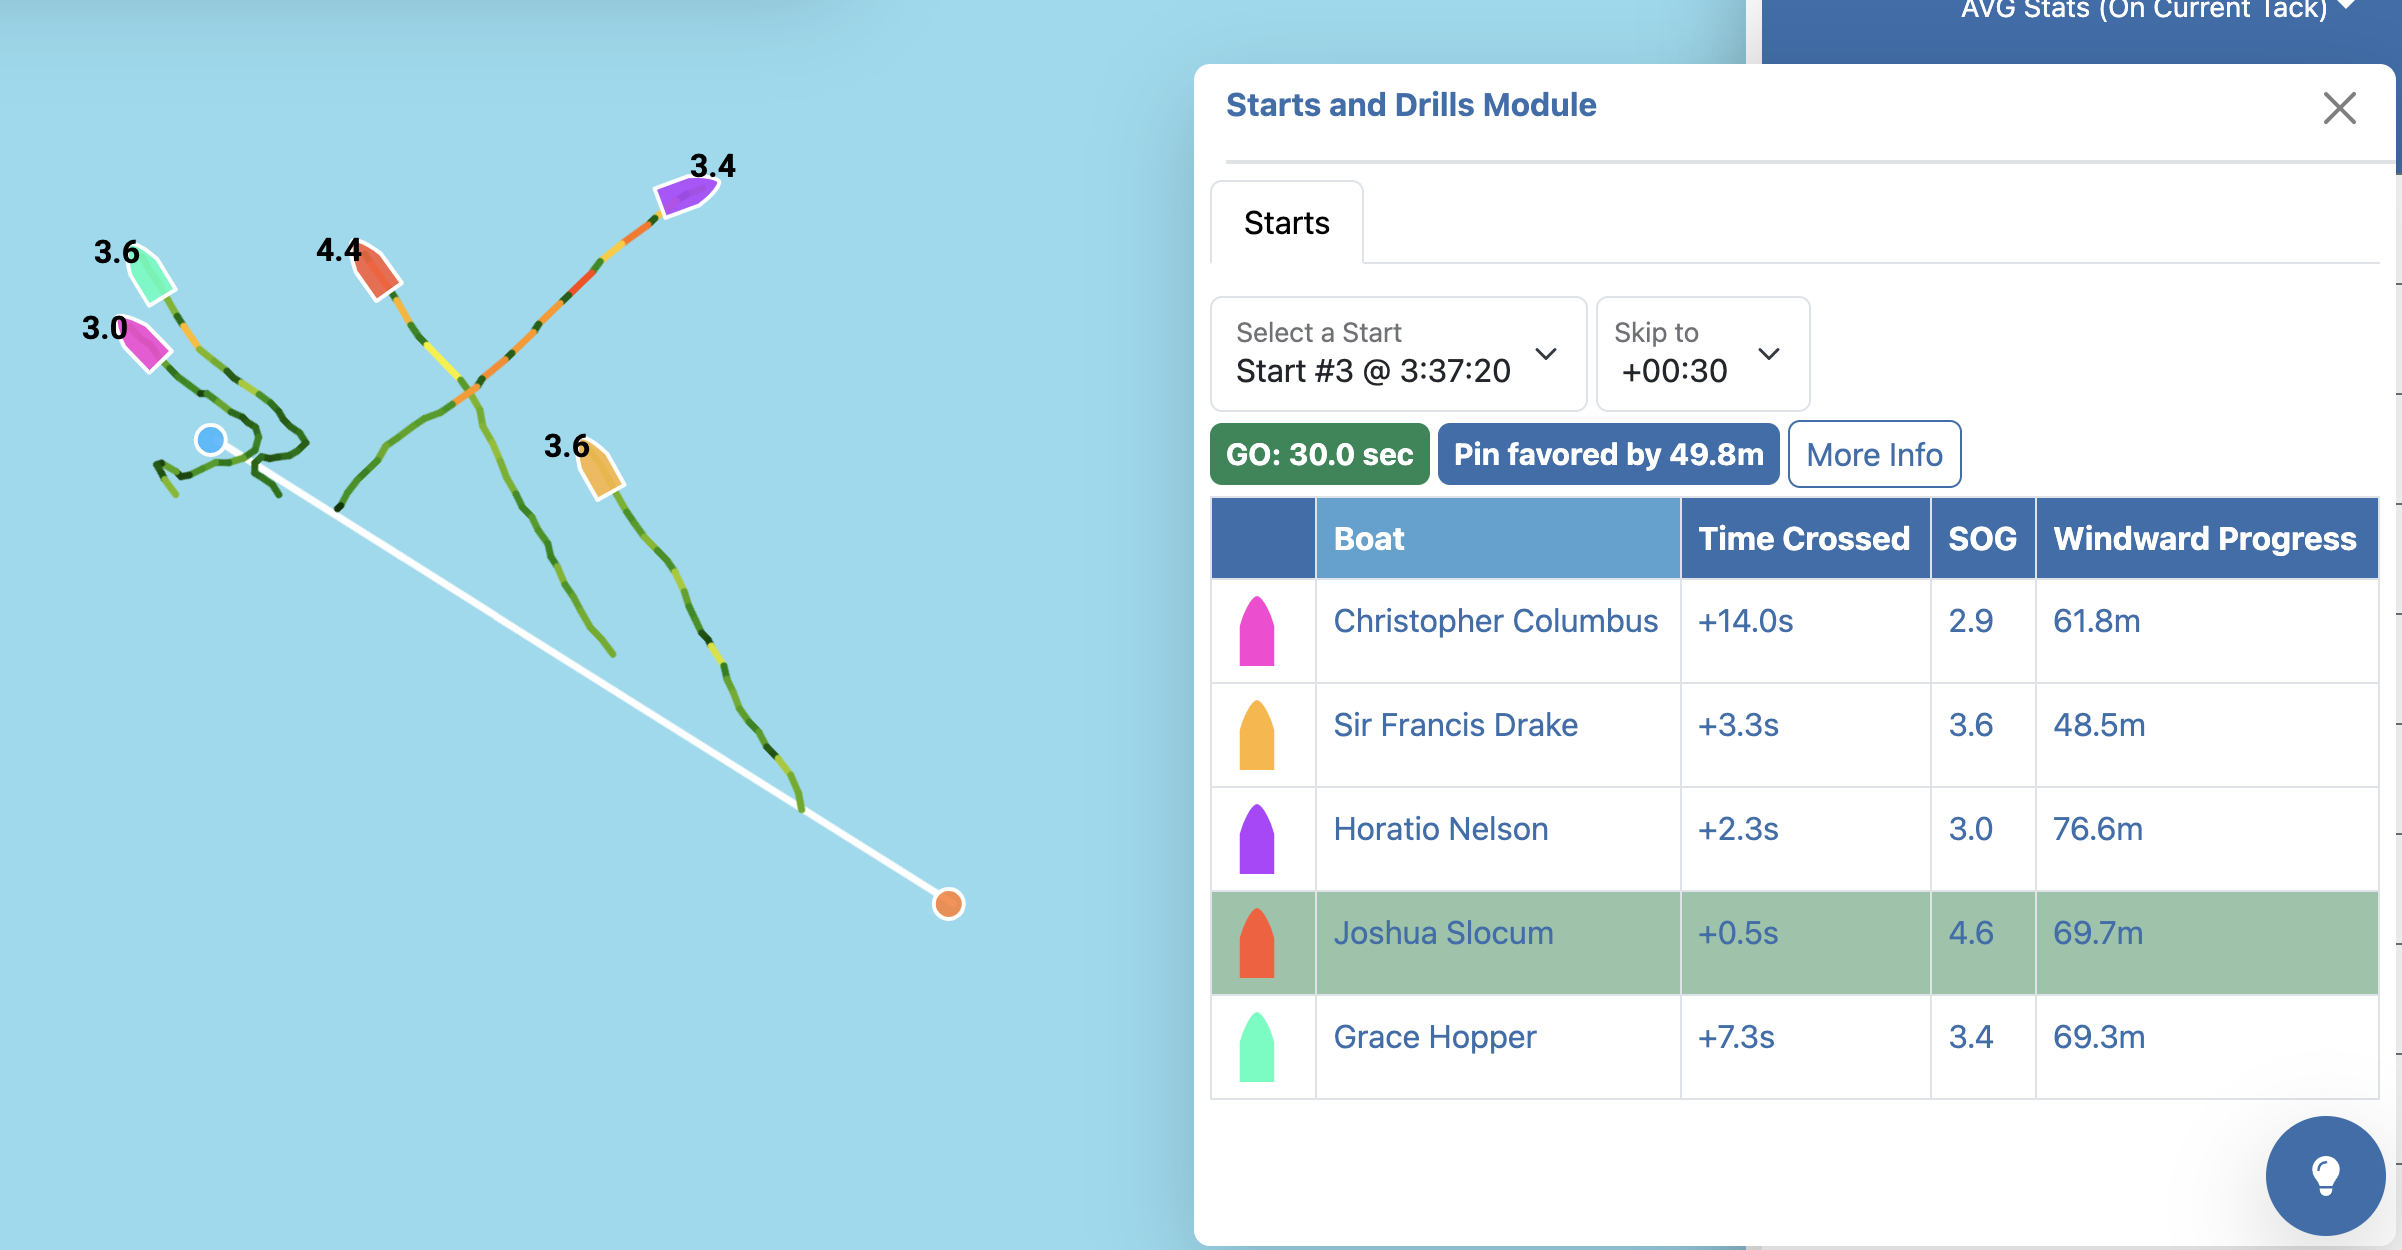
Figure 1: Reviewing start positioning and metrics at GO. We can see that Joshua nailed the start in terms of timing, but he put himself at a large disadvantage due to his positioning on the line setting him back almost 20m. Review Figure 2 to see how it played out.
Step Through Key Moments: Look at positions at 60 seconds, 30 seconds, 15 seconds, 5 seconds before the start, and then check the first few moments after the start to see how each boat executed its plan or how long it took them to reach full speed.
Overlay GPS Tracks: Compare multiple boats’ approaches, acceleration strategies, and how well they accounted for line bias.
Video Footage (If Available): Evaluate positional awareness, timing, and sail trim during these critical countdown moments.
Having precise coordinates for each end of the line ensures your analysis will match the on-water reality, which is far more accurate than guessing.
b) Identifying patterns
Timing Issues: Look for trends where teams are consistently late or early.
Acceleration Techniques: Pinpoint moments of slow transitions or missed opportunities to power up just before the start.
Bias Recognition & Windward Progress: Check how sailors leveraged the favored end of the line. Use the concept of “windward progress” to quantify the advantage. For example, if the pin is favored by 50 meters, starting at the pin means you effectively gain 50 meters of windward progress over a boat starting at the boat end.
Figure 2: Reviewing stats 30 seconds after Go to see how things played out. We can see Horatio has executed the best first leg of the race largely due to his advantageous position off the line and his decent timing off the line. While Joshua had the best timing off the line, as we discussed in figure 1 he wasn’t able to fully make up for starting too far from the favored end in comparison to Horatio.
c) Tactical vs. Execution Insights
Tactical Choices: Even perfect timing won’t help if you’re on the wrong end of a heavily biased line. As you can see from the Purple boat above who crossed the line almost 2 seconds later than the Red boat and yet was 15m ahead (almost 6-7 boat lengths on him) because of his positioning closer to the favored end. It can really help sailors when they are able to visually see their tracks drawn with the line oriented into the wind, so they learn what they need to pay attention to next time they’re on the water.
d) AI Summarized Breakdown
If you’re short on time—or simply want a less technical overview—use our AI-powered summary tool to:
Highlight Key Events: Quickly see where boats converged on the line and how their timing stacked up.
Pinpoint Errors & Wins: Get a concise list of errors (e.g., overshooting, poor acceleration) and best practices that worked well (e.g., good speed off the line, correct bias calls).
Streamline Debrief: Save time by letting the AI extract core insights so you can focus on coaching tips and next steps, rather than digging through raw numbers.
See sample below generated from this start:
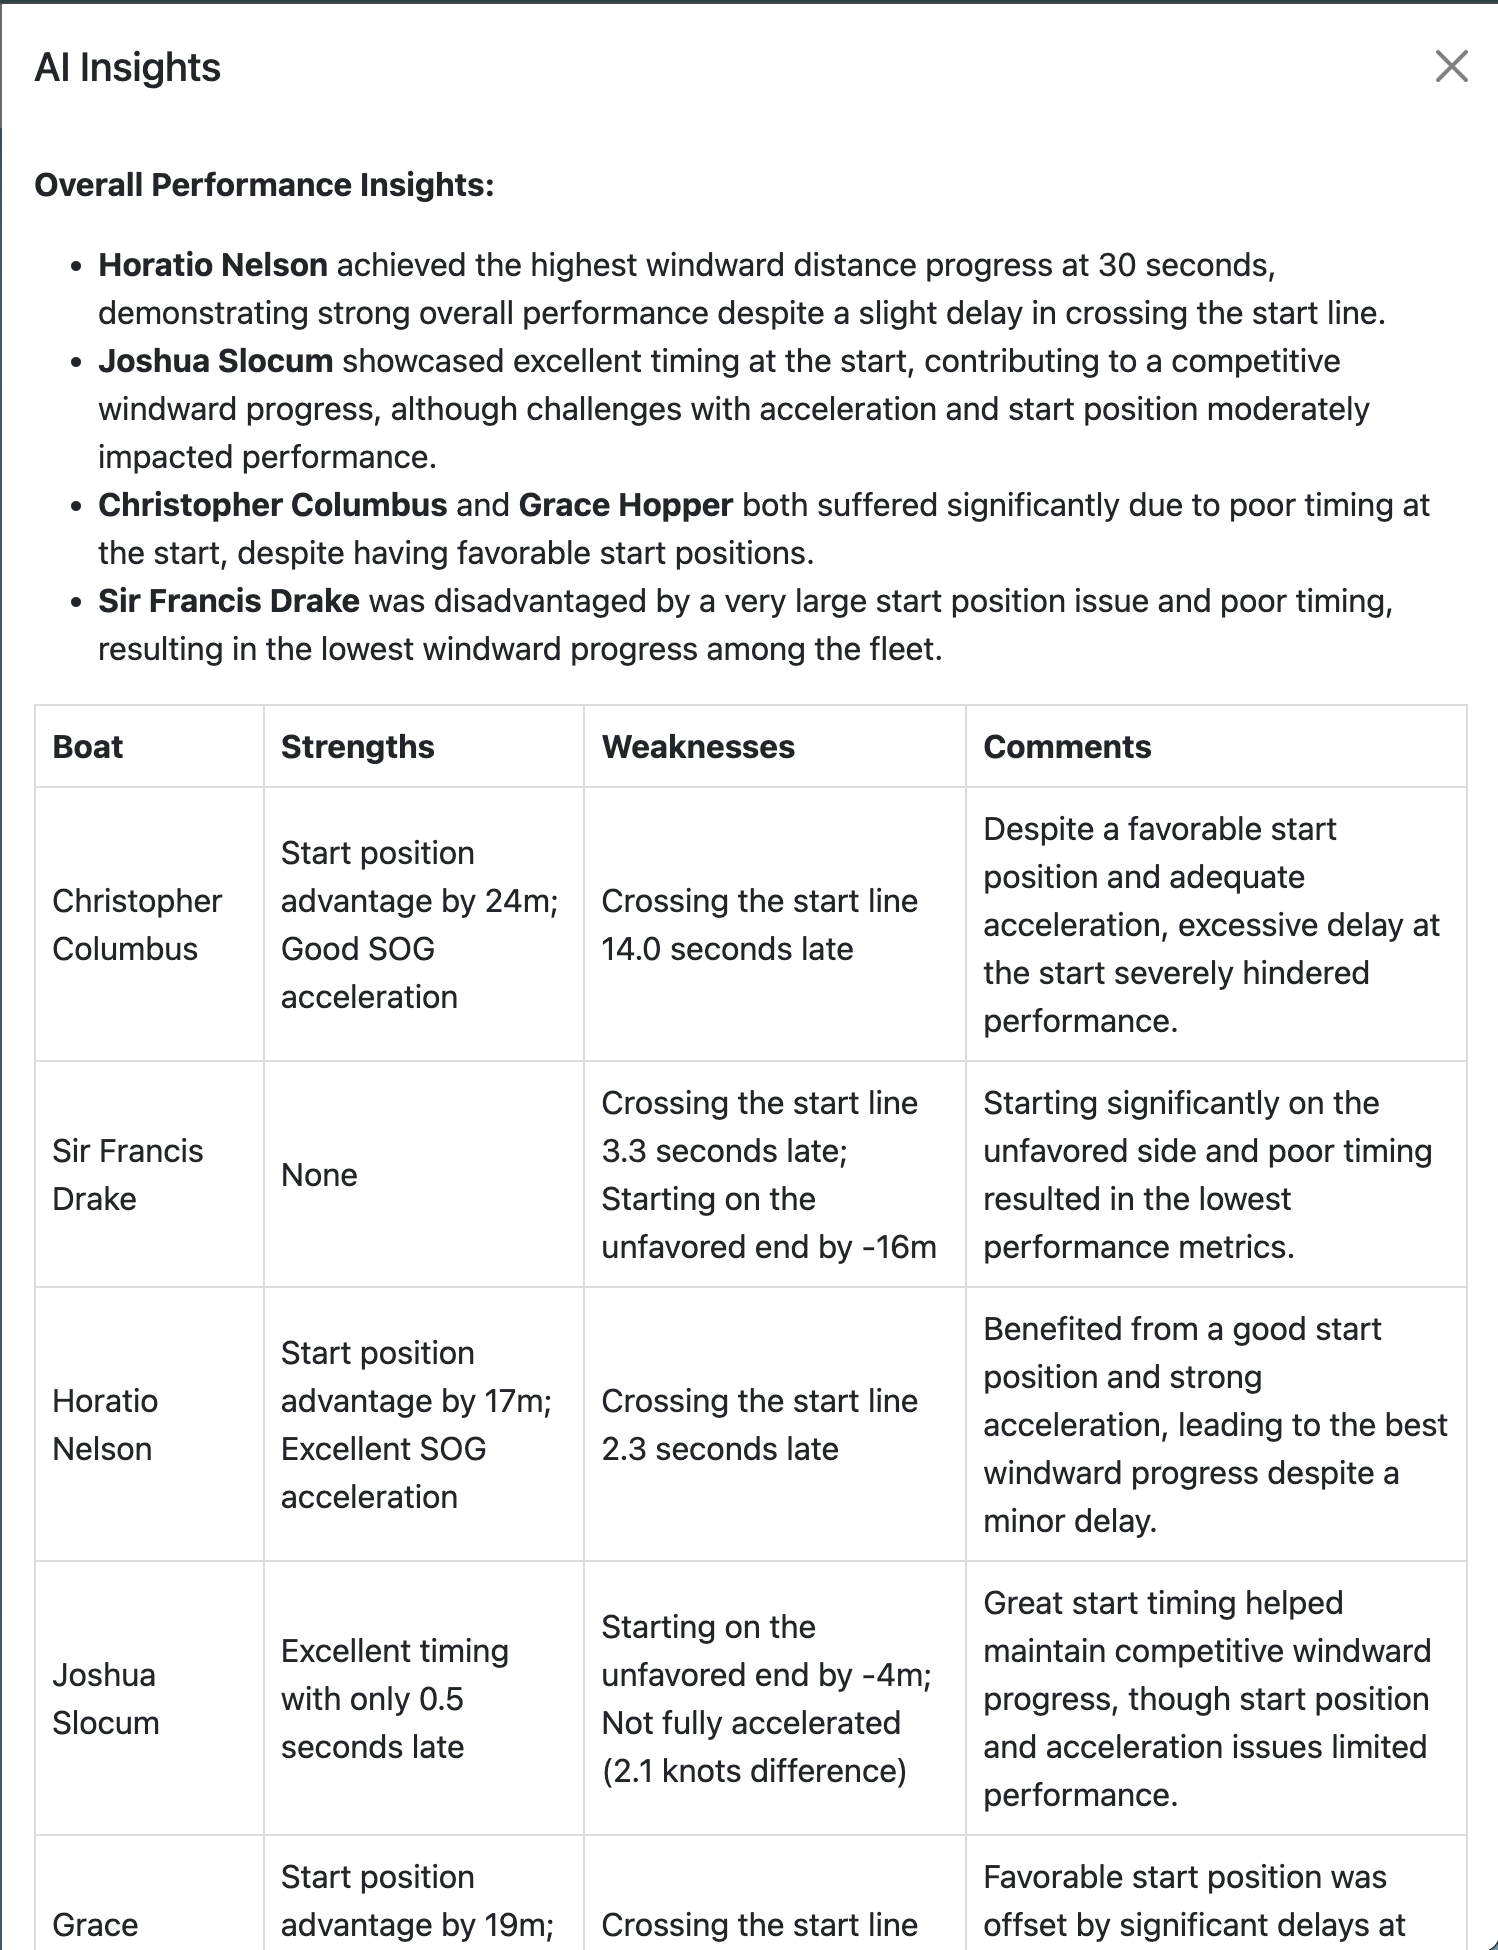
Figure 3: AI Summarized Review of Start across different moments to highlight strengths and weaknesses instantly.
6. Practical Tips
Data recording: Make sure your fleet knows how to record data before they hit the water.
Use Consistent Signals A standard horn or flag sequence each time helps align data timestamps with the start gun. Just make sure you start the sequence on a given minute.
Focus on Key Metrics: Speed at the gun, distance to the line, and how effectively sailors leveraged line bias.
Document Your Progress: Encourage sailors to log their approach, bias calls, and timing decisions, then compare notes with actual data to see where adjustments are needed.
7. Final Thoughts
A data-driven approach to start practice replaces guesswork with clear, measurable insights. By pairing each start with a specific clock time, capturing precise start-line coordinates, and centralizing everyone’s GPS logs in a shared platform like SailSync, you lay the groundwork for thorough analysis—without sacrificing efficiency. Over time, these repeatable, transparent drills lead to more confident, consistent starts and better results when it matters most on the racecourse.
Ready to run your data-powered clinic today? Get started today at www.sailsync.ai